Data sourced from SnapStats Publishing.
October 2017 Market Update
This is the price analysis for the month of October 2017 in Burnaby. It includes detailed information on detached homes, attached condos and townhomes. Take a look at the current market trends!
Market Summary
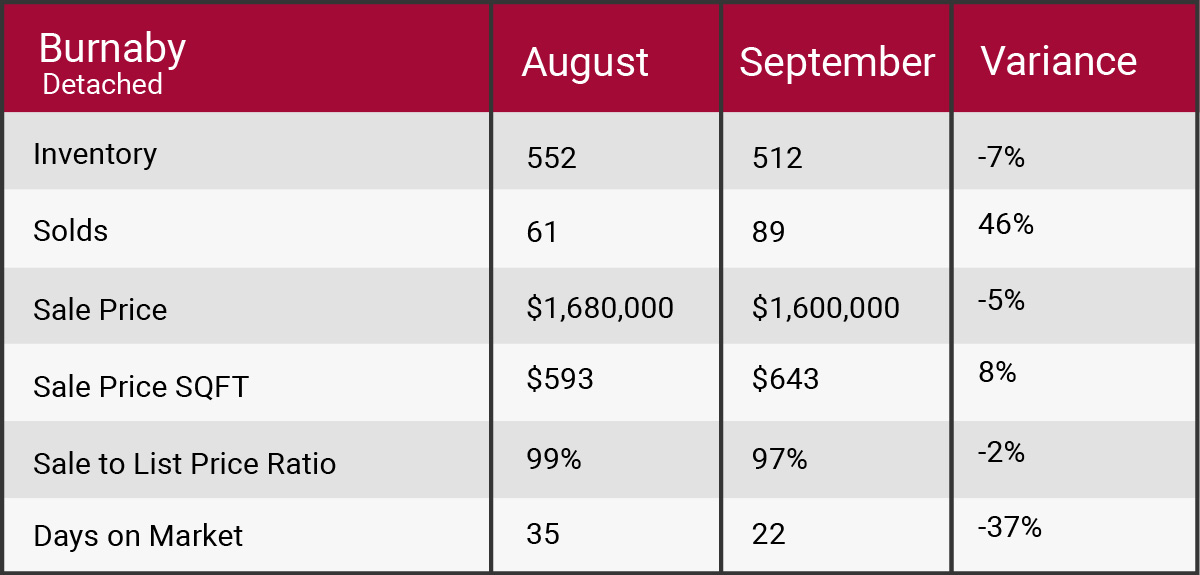
- Official Market Type BURNABY DETACHED: Balanced market at 17% Sales Ratio average (1.7 in 10 homes selling rate)
- Homes are selling on average 3% below list price
- Most Active Price Band** $1 mil to $1.25 mil with average 53% Sales Ratio (Sellers market)
- Buyers Best Bet** Homes between $2.75 mil to $3 mil, Government Road, Montecito and minimum 7 bedroom properties
- Sellers Best Bet** Selling homes in Burnaby Hospital, Vancouver Heights and up to 2 bedroom properties
Market Summary
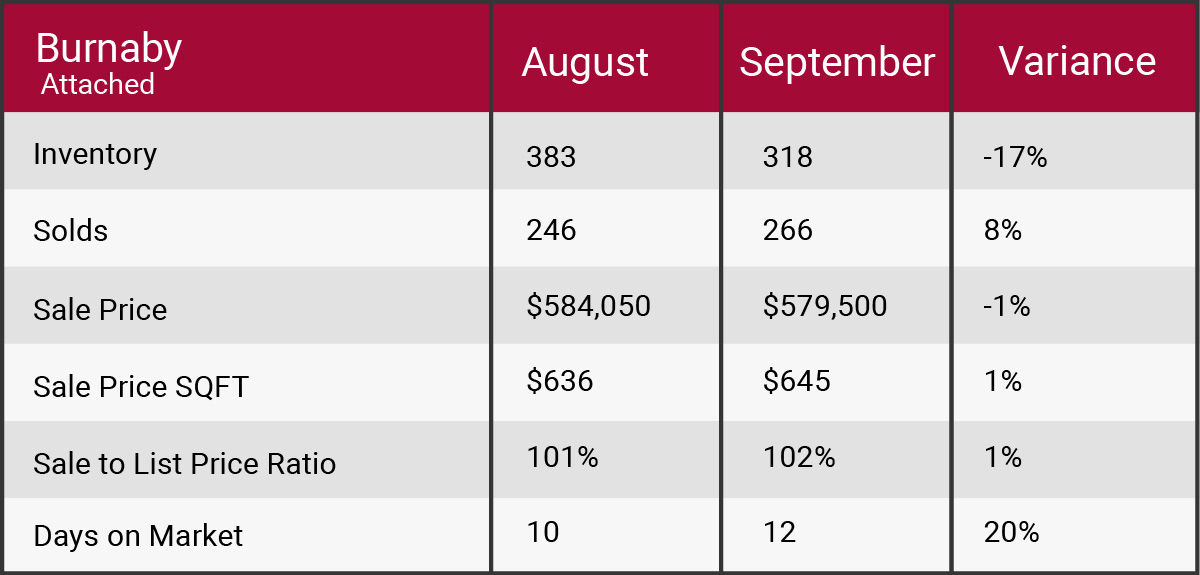
- Official Market Type BURNABY ATTACHED: Sellers market at 84% Sales Ratio average (8.4 in 10 homes selling rate)
- Homes are selling on average 2% above list price
- Most Active Price Band** $500,000 to $600,000 with average >100% Sales Ratio (Sellers market)
- Buyers Best Bet** Homes between $1 mil to $1.25 mil, Central, Vancouver Heights and minimum 4 bedroom properties
- Sellers Best Bet** Selling homes in Brentwood Park, Forest Hills, Government Road, Highgate and up to 1 bedroom properties
*With a minimum inventory of 10 in most instance