Data sourced from SnapStats Publishing.
May 2018 Market Update
See the below price analysis for May 2018 in Burnaby. It includes detailed information on detached homes, attached condos and townhomes. Check out the current market trends!
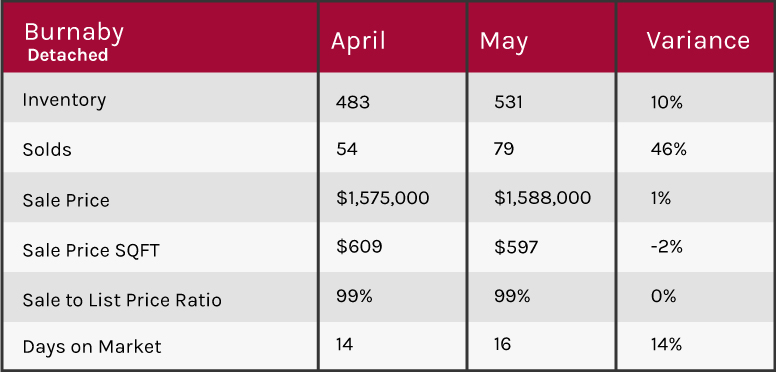
Market Summary For Detached
- Balanced Market at 15% Sales Ratio average (1.5 in 10 homes selling rate)
- Homes are selling on average 1% below list price
- Most Active Price Band $1 mil to $1.25 mil with average 60% Sales Ratio (Sellers market)
- Buyers Best Bet* Homes between $2.25 mil to $2.5 mil and $275 mil to $3 mil, Burnaby Lake and minimum 7 bedroom properties
- Sellers Best Bet* Selling homes in Montecito and 3 to 4 bedroom properties
*With a minimum inventory of 10 in most instances
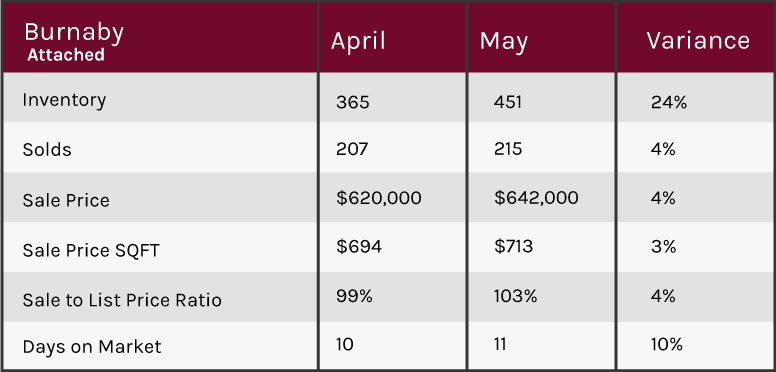
Market Summary for Attached
- Sellers Market at 48% Sales Ratio average (4.8 in 10 homes seiling rate)
- Homes are selling on average 3% above list price
- Most Active Price Band** $600,000 to $700,000 with average 79% Sales Ratio (Sellers market)
- Buyers Best Bet* Homes between $1 mil to $1.25 mil, Vancouver Heights and 3 bedroom properties
- Sellers Best Bet** Selling homes in Government Road, SFU, Sullivan Heights and up to 1 bedroom properties
*With a minimum inventory of 10 in most instances