Burnaby Real Estate Market Update Dec 2018
Data sourced from SnapStats Publishing.
December 2018 Market Update
See the below price analysis for Dec 2018 in Burnaby. It includes detailed information on detached homes, attached condos and townhomes. Check out the current market trends!
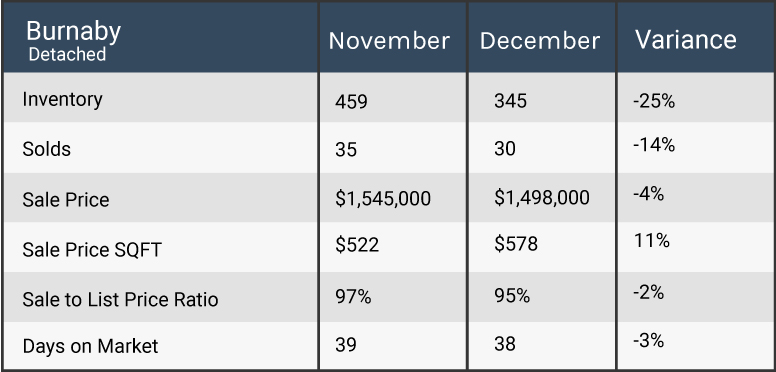
Market Summary For Detached
- Buyers Market at 9% Sales Ratio average (9 in 100 homes selling rate)
- Homes are selling on average 5% below list price
- Most Active Price Band** $1 mil to $1.25 mil with average 56% Sales Ratio (Sellers market)
- Buyers Best Bet** Homes between $2.5 mil to $2.75 mil, Metrotown, Parkcrest, South Slope and minimum 5 bedroom properties
- Sellers Best Bet* Selling homes in Burnaby Hospital, East Burnaby and up to 2 bedroom properties
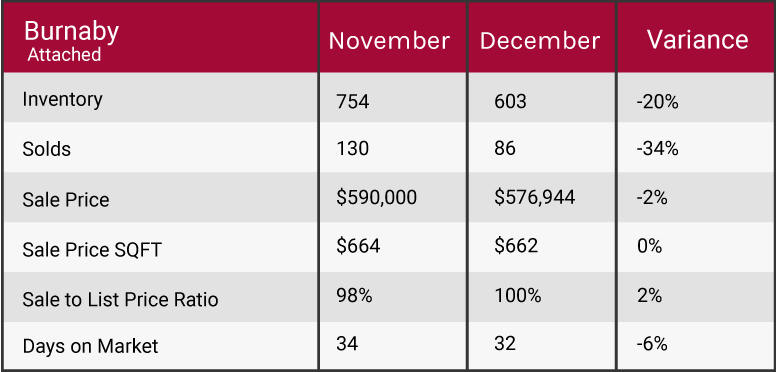
Market Summary for Attached
- Balanced Market at 14% Sales Ratio average (1.4 in 10 homes selling rate)
- Homes are selling on average 100% of list price
- Most Active Price Band** $300,000 to $400,000 with average 47% Sales Ratio (Sellers market)
- Buyers Best Bet** Homes between $1 mil to $1.25 mil, Forest Glen, Metrotown, SFU and 2 bedroom properties
- Sellers Best Bet** Selling homes in Central Park, South Slope and up to 1 bedroom properties