Vancouver and Burnaby Real Estate Market Update July 2017
- Homepage
- >
- Market Update
- >
- Vancouver and Burnaby Real Estate Market Update July 2017
Data sourced from SnapStats Publishing.
July 2017 Market Update
This is the price analysis for the month of July 2017 in Vancouver and Burnaby. It includes detailed information on detached homes, attached condos and townhomes. Take a look at the current market trends!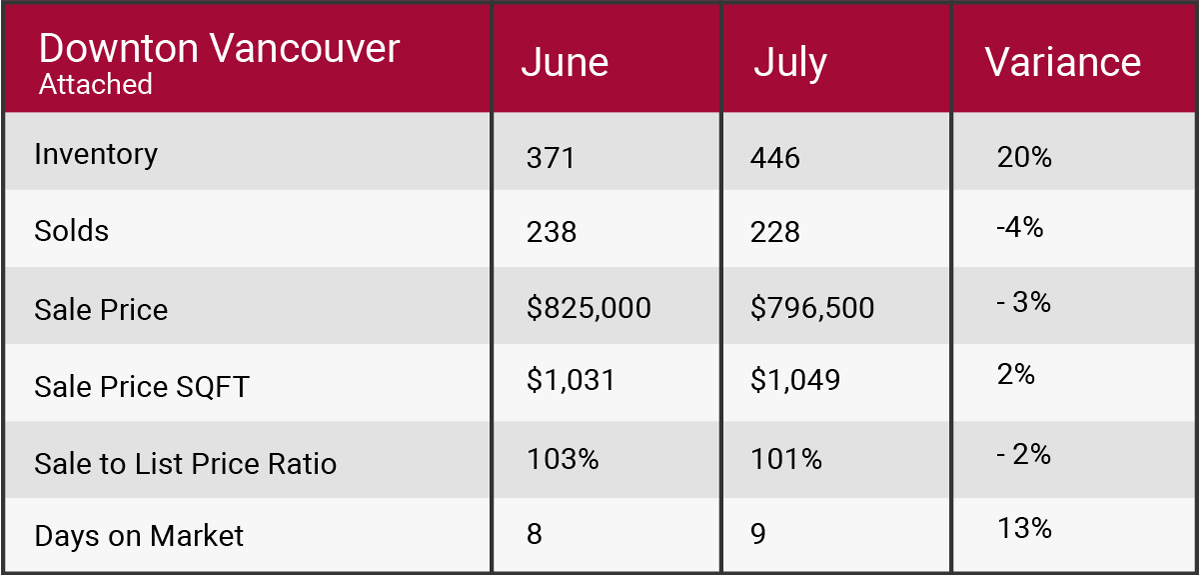
Market Summary
- Official Market Type DOWNTOWN:Sellers market at 51% Sales Ratio average (5.1 in 10 homes selling rate)
- Homes are selling on average 1% above list price
- Most Active Price Band**+/-$1 mil:$600k to $700k (>100% SalesRatio) /$1 mil to $1.25 mil(65% Sales Ratio)
- Buyers BestBet**+/-$1 m il:Homes between $900k to $1 mil/$1.5 mil to $1.75 mil & $2 mil to $2.25 mil and 3 bedrooms
- Sellers BestBet**Selling homes in Downtown, Yaletown and up to 1 bedroom properties
Market Summary
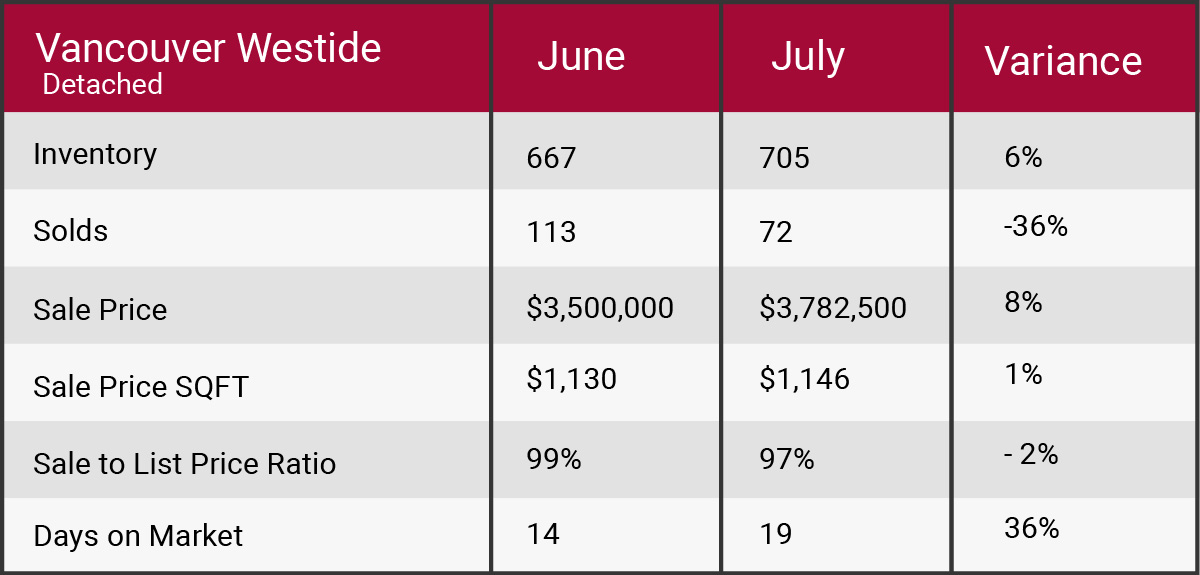
- Official Market Type WESTSIDE DETACHED:Buyers market at 10% Sales Ratio average (1 in 10 homes selling rate)
- Homes are selling on average 3% below list price
- Most Active Price Band**+/-$3 mil:$2.25 mil to $2.5 mil(29% Sales Ratio) /$4 mil to $4.5 mil(22% Sales Ratio)
- Buyers Best Bet**+/-$3 m il:Homes between $2.75 mil to $3 mil /$5 mil plus, Kerrisdale, PointGrey, SW Marine and Shaughnessy
- Sellers Best Bet**Selling homes in Oakridge and 3 to 6 bedroom properties
Market Summary
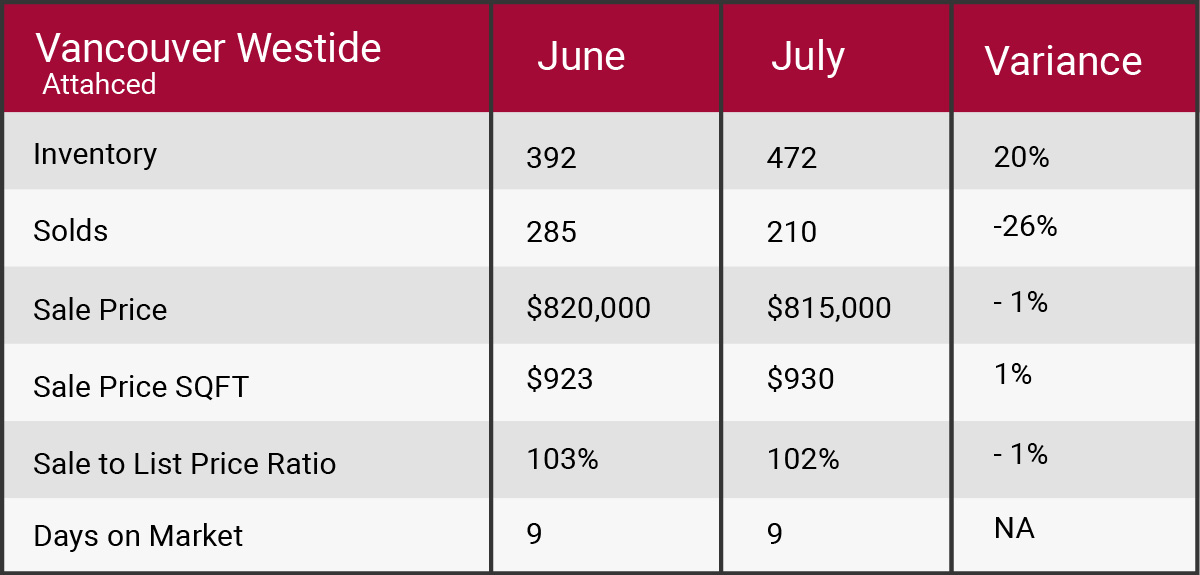
- Official Market Type WESTSIDE ATTACHED:Sellers market at 44% Sales Ratio average (4.4 in 10 homes selling rate)
- Homes are selling on average 2% above list price
- Most Active Price Band**$400,000 to $500,000 with average >100% Sales Ratio (Sellers market)
- Buyers Best Bet**Homes between $1.75 mil to $2 mil, Cambie, Kerrisdale, South Granville and minimum 4 bedroom properties
- Sellers Best Bet**Selling homes in Fairview, Kitsilano, Mount Pleasant and up to 1 bedroom properties
Market Summary
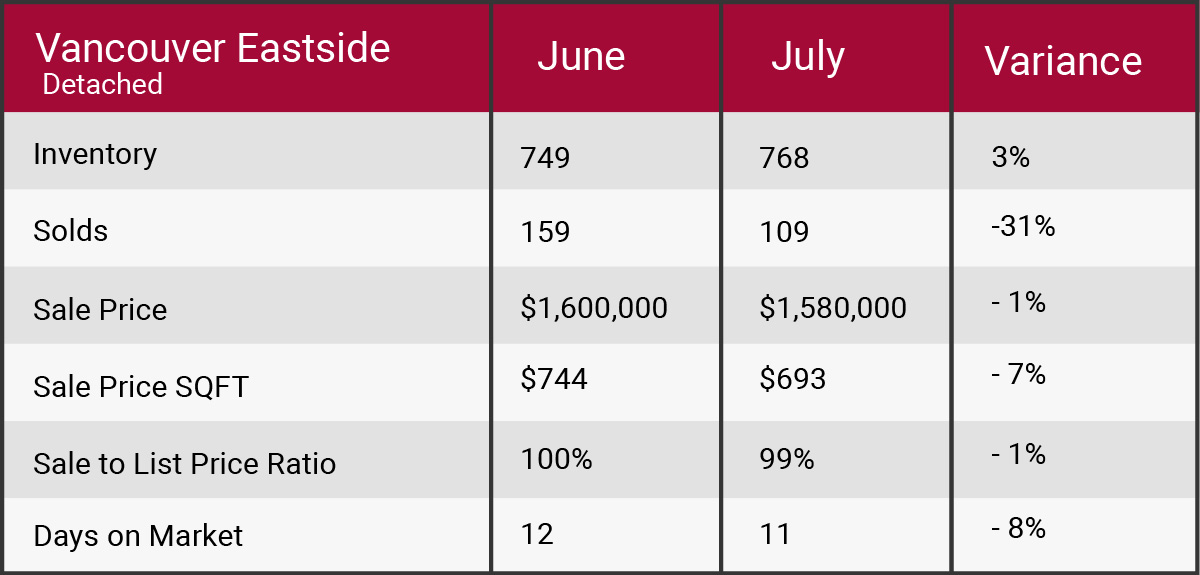
- Official Market Type EASTSIDE DETACHED:Buyers market at 14% Sales Ratio average (15% is a Balanced market)
- Homes are selling on average 1% below list price
- Most Active Price Band**$1 mil to $1.25 mil with average 50% Sales Ratio (Sellers market)
- Buyers Best Bet**Homes between $2.75 mil to $3 mil, Collingwood, Grandview, Killarney and minimum 7 bedroom properties
- Sellers Best Bet**Selling homes in Fraser, Hastings East, Mount Pleasant and 3 to 4 bedroom properties
Market Summary
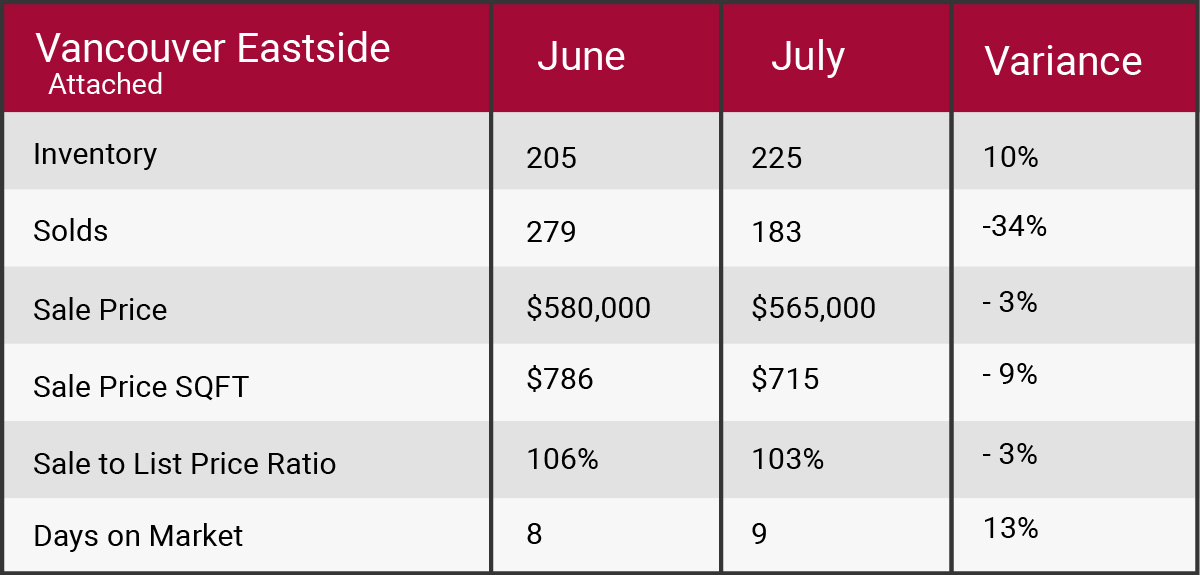
- Official Market Type EASTSIDE ATTACHED:Sellers market at 81% Sales Ratio average (8.1 in 10 homes selling rate)
- Homes are selling on average 3% above list price
- Most Active Price Band**$400,000 to $500,000 with average >100% Sales Ratio (Sellers market)
- Buyers Best Bet**Homes between $1.25 mil to $1.5 m il,Downtown,Killarney, Victoria and 3 bedroom properties
- Sellers Best Bet**Selling homes in Collingwood, Fraser, Grandview, Mt Pleasant and up to 1 bedroom properties
Market Summary
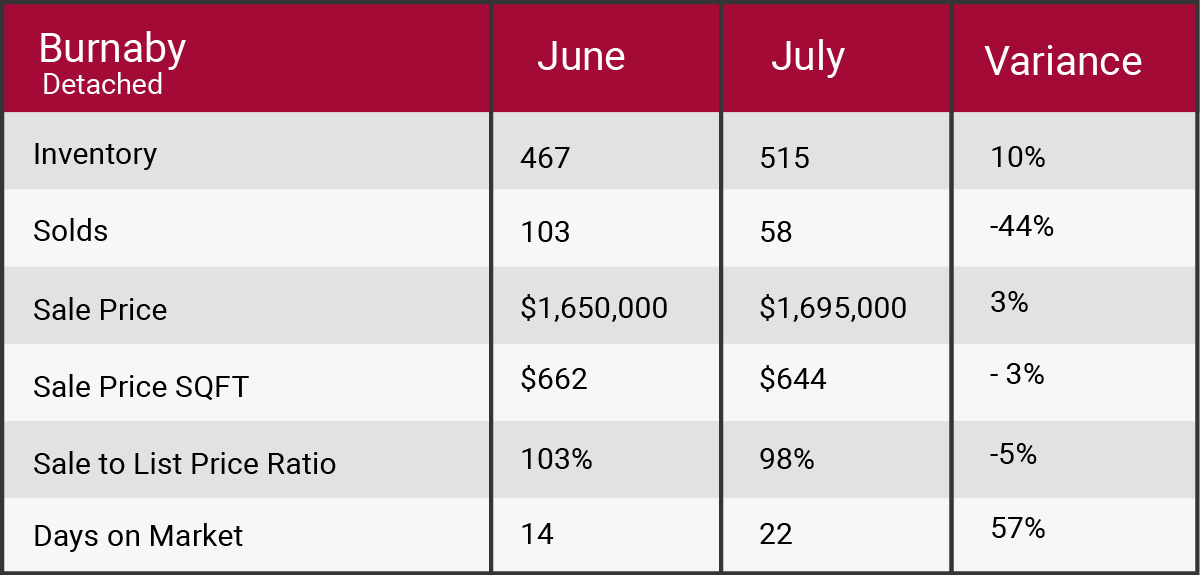
- Official Market Type BURNABY DETACHED:Buyers market at 11% Sales Ratio average (1.1 in 10 homes selling rate)
- Homes are selling on average 2% below list price
- Most Active Price Band**$1.25 mil to $1.5 mil with average 21% Sales Ratio (Sellers market)
- Buyers Best Bet**Homes between $2 mil to $2.5 mil, Capitol Hill, Forest Glen, Montecito, Parkcrest, S.Slope and Sperling-Duthie
- Sellers Best Bet**Selling homes in Brentwood Park, The Crest, Upper Deer Lake and 3 to 4 bedroom properties
Market Summary
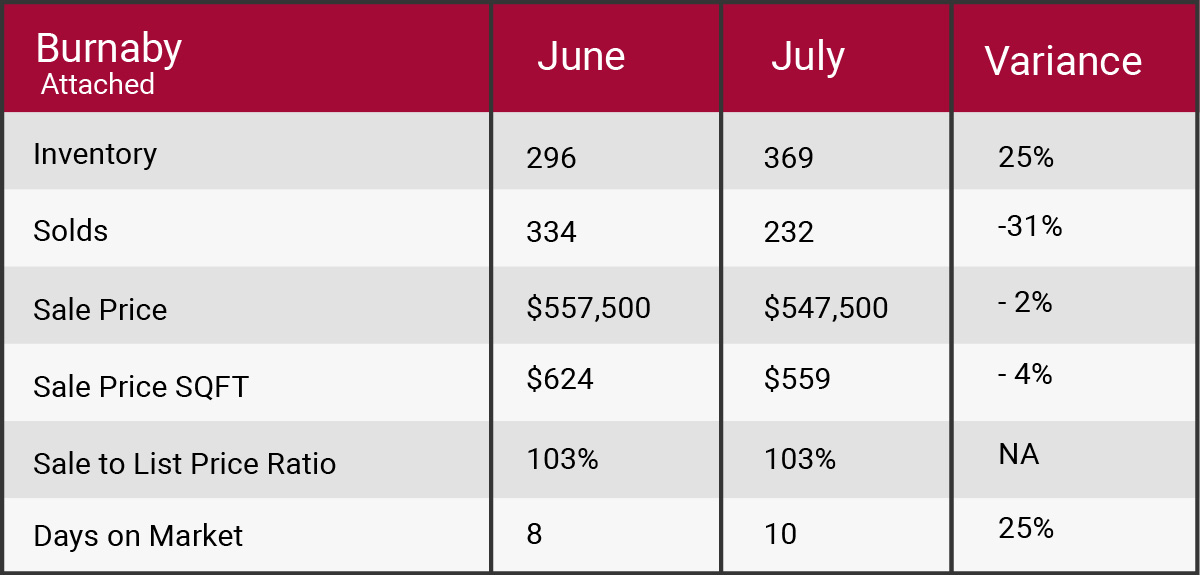
- Official Market Type BURNABY ATTACHED:Sellers market at 63% Sales Ratio average (6.3 in 10 homes selling rate)
- Homes are selling on average 3% above list price
- Most Active Price Band**$300,000 to $400,000 with average 91% Sales Ratio (Sellers market)
- Buyers Best Bet**Homes between $800,000 to $900,000, Governm entRd,VancouverHeights and 3 bedroom properties
- Sellers Best Bet**Highgate, SFU, South Slope, Sullivan Heights and up to 1 bedroom properties
